
Also known as Relations Diagrams
When you have a problem to solve, it can be useful to identify all of the possible causes, then address each one in turn. This is fine in many situations, but it can also be time-consuming and costly...
In situations where the possible causes are going to be expensive to deal with, it's helpful to use an Interrelationship Diagram, instead. These simple diagrams help you to map out the relationships between all possible causes of the problem, so that you can identify the most significant ones and focus on those first.
In this article, we'll look at Interrelationship Diagrams, and we'll explore how you can use them to identify the probable root causes of a problem.
About Interrelationship Diagrams
Interrelationship Diagrams (also known as Relations Diagrams) are simple diagrams that help you find the root causes of a problem, by helping you understand the relationships between all of the issues that you face. The technique is often associated with Six Sigma, but you can use it in many situations.
Once you've created an Interrelationship Diagram, you'll be able to see which issues are fundamental causes of your problem and which are the effects (symptoms) of these causes. You'll also have a good understanding of which causes you need to deal with first, so that you can make best use of your time and resources.
Access the essential membership for Modern Managers
How to Use Interrelationship Diagrams
It's easy and simple to create an Interrelationship Diagram.
You can do this alone or with your team. If you're on your own, all you'll need is a large piece of paper and a pen. If you're with a group, you can use a whiteboard, flipchart, or computer and data projector. You may also find sticky notes helpful.
Step 1: Identify Your Problem
Your first step is to write down the problem that you need to solve. Write this issue at the top of the paper or whiteboard that you're using.
Example
Janet and her team members are trying to analyze why morale in their organization has plummeted. She starts her Interrelationship Diagram by writing this down at the top of a whiteboard.
Access the essential membership for Modern Managers
Step 2: Brainstorm Possible Causes
You now need to brainstorm issues that may be contributing to your central problem. As you identify these, write each one down around the edge of your piece of paper, or write them on a sticky note, so that you can move them around.
Explore using tools such as Brainstorming, Cause and Effect Analysis, Root Cause Analysis, CATWOE, and the 5 Whys to identify as many of the issues related to your problem as possible.
Example
Janet's team members come up with the following issues that they believe might be causing low morale:
- A recruitment freeze.
- Falling sales.
- No training opportunities.
- No promotion opportunities.
- Staff under pressure from management.
- Negative attitudes.
- Pay freezes.
- People working long hours.
- Dreary workspaces.
- Miscommunication, resulting in rumors.
She adds these to her Interrelationship Diagram, as shown in figure 1 below.
Access the essential membership for Modern Managers
Figure 1 – Step 2 of Janet's Interrelationship Diagram

Step 3: Identify Cause and Effect Relationships
Now, go through each issue and identify whether it is a cause of another issue or an effect (symptom).
If it's a cause of another issue, draw an arrow from it and connect it to the issue it affects. If it's an effect of another issue, draw an arrow to it from the other issue.
Go through each issue to make sure that you have analyzed the causes and effects thoroughly.
Example
Access the essential membership for Modern Managers
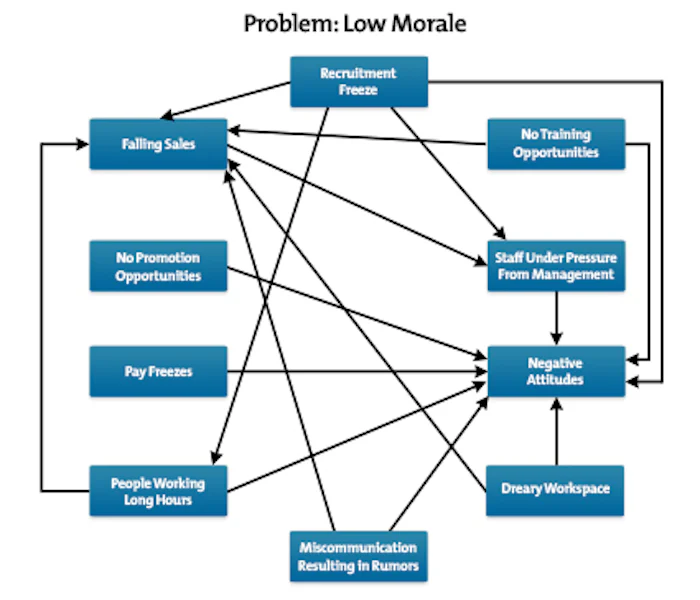
Janet and her team identify the cause and effect relationships shown in figure 2, below.
Figure 2 – Step 3 of Janet's Interrelationship Diagram
Note:
Avoid drawing two-headed arrows – for the purposes of these diagrams, a relationship shouldn't be both a cause and an effect.
Step 4: Identify Causes and Effects
Now, count up the number of arrows going in and going out for each issue.
Issues with the highest number of arrows leading out are likely to be important drivers or root causes of your problem. (You should also pay attention to issues that feed into these.)
Access the essential membership for Modern Managers
Issues with a high number of arrows leading in are probably important outcomes or effects. You should be able to eliminate many of these as you deal with the root causes.
Example
Janet tallies up the arrows for each issue as follows:
Issue
Arrows In
Arrows Out
Access the essential membership for Modern Managers
Recruitment freeze.
0
4
Falling sales.
5
1
No training opportunities.
Access the essential membership for Modern Managers
0
2
No promotion opportunities.
0
1
Staff under pressure from management.
2
Access the essential membership for Modern Managers
1
Negative attitudes.
8
0
Pay freezes.
0
1
Access the essential membership for Modern Managers
People working long hours.
1
2
Dreary workspace.
0
2
Miscommunication resulting in rumors.
Access the essential membership for Modern Managers
0
2
She can now see that the recruitment freeze is likely the most significant cause of her problem, as this is contributing to four other issues.
Miscommunication, a dreary workspace, and lack of training opportunities are also causes of several issues (without having causes themselves).
Tip:
If you want to, you can identify the strength of each relationship by using a solid or dotted arrow: solid arrows represent strong relationships, and dotted arrows represent weaker relationships.
Then score each issue appropriately when you tally up the arrows in and out, using, say, 0.5 for a dotted arrow and 1 for a solid arrow.
Step 5: Deal With the Root Causes
Once you've analyzed your Interrelationship Diagram, you can take steps to deal with the root causes of your problem, or you can do further analysis.
Access the essential membership for Modern Managers
When you analyze your diagram, bear in mind that each of the effects that you have identified will have a different bearing on your overall problem. That's why it can be useful to use decision-making tools such as Decision Matrix Analysis, Pareto Analysis, and Force-Field Analysis when deciding which issues to deal with first.
Key Points
Interrelationship Diagrams are useful tools that help you identify the root causes of problems.
There are five steps in using an Interrelationship Diagram:
- Define your problem.
- Brainstorm possible causes.
- Identify cause and effect relationships.
- Identify causes and effects.
- Deal with the root causes.
It's best to use this technique alongside other problem-solving and decision-making tools.
Share this post
Discover more content

The Four Frame Approach
This model helps you lead more effectively by analyzing business situations from different leadership perspectives.

Problem-Solving Sabotage
There are a number of things that can unintentionally hinder effective problem-solving. These top tips will help you remain vigilant to potential pitfalls and improve your chances of successful resolution.

Analysing Potential Problems
The ‘What if? technique is a quick and easy creative thinking technique that can help generate potential solutions to almost any problem.