
When you're thinking about your organization, have you ever said to yourself that the right hand doesn't know what the left hand is doing?
Chances are you have! Despite all the efforts we make to streamline business operations and flatten structures, there are still a great many activities that involve more than one department or team.
This means connections, communications and hand-offs between different sets of people. And these create the risk of processing gaps, inefficiencies and duplications, which can impair performance or increase costs.
However, by having a formal method for identifying and integrating processes between parts of your organization, you can ensure that all the "meeting points" between departments are well designed and managed.
In this article we explain one such method for doing this: "Swim Lane Diagrams," also known as "Rummler-Brache Diagrams."
Access the essential membership for Modern Managers
What Are Swim Lane Diagrams/Rummler-Brache Diagrams?
Swim Lane Diagrams were first proposed by Geary Rummler and Alan Brache. [1] Their method of diagramming allows you to quickly and easily plot and trace processes and, in particular, the interconnections between departments and teams.
Like other process-diagramming techniques, with the Rummler-Brache method you map processes linearly as a series of tasks across the page. Lines and arrows between tasks represent the flow of information, goods or work-in-progress, and also represent changes in responsibility.
The identifying feature here is the use of "swim lanes": horizontal rows across the diagram page. Think of a swim meet where each competitor has their own lane to swim in. In this diagramming method, each "swim lane" may belong to an individual, a team, a department, or any other organization unit you choose.
Process diagrams, in general, are a great tool for spoting processing gaps and inefficiencies. The added advantage of the Rummler-Brache or Swim Lane Diagram approach is that it focuses on the high-risk interconnections between departments and teams, and allows you to spot any associated issues and risks.
An Example of a Swim Lane Diagram
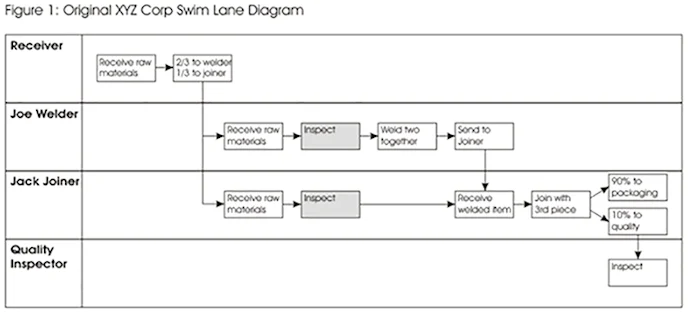
Here's a simple manufacturing example: XYZ Corp. makes "Grommels". Grommels are made of three pieces of metal, two of which are welded together and then joined with the third.
Access the essential membership for Modern Managers
Improving the Process
Once the diagram is complete, it's easy to see who's responsible for what. It's also easy to start identifying potential inefficiencies. The diagram technique helps you to break down your process so that you can spot the bottlenecks, redundancies, and other causes of inefficiency, and so get on with improving your business process.
For example, when you look at the Grommel manufacturing process, there's potential redundancy in the raw material inspection. If the Receiver were to inspect the raw material before sending it on to Welder or Joiner, then both of those guys could concentrate on their main activities: welding and joining.
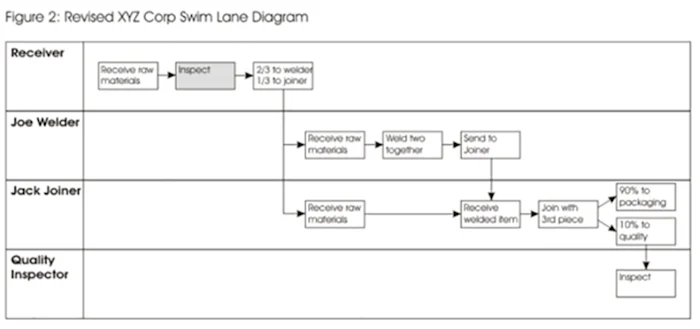
Figures from "Improving Performance: How to Manage the White Space in the Organization Chart" by Geary A. Rummler and Alan P. Brache. © 1995 Jossey-Bass Inc. Reproduced with permission of John Wiley & Sons Ltd.
Creating Rummler-Brache Diagrams
Access the essential membership for Modern Managers
The first step in spotting inefficiencies and making improvements is to break down your organization's processes into manageable pieces. If you tried to look at everything at once and in detail, you'd be overwhelmed. So before you get started, it's important to clarify what you're trying to accomplish with the Rummler-Brache method, and so determine the right areas of focus and level of detail.
If you're trying to find strategic inefficiencies, then analyzing every process in detail is unnecessary and cumbersome. Here you might assign each main functional area to a swim lane and look at the interchanges in and between them. This would help you to spot disconnects between functional areas of the business.
If you were trying to diagnose inefficiencies in your hiring and recruitment process then you'd look at specific roles, departments, and perhaps some key individuals, and assign these to the swim lanes.
For a comprehensive approach, you may start by analyzing the processes and organization using high-level Swim Lane Diagrams. Then, once you've spotted areas that you need to focus on, you can drill down there using more-detailed diagrams.
6 Steps for Using Swim Lane Diagrams Effectively
Let's look at the six steps you need to take in order to use Swim Lane Diagrams well:
1. Determine What You Aim to Accomplish.
Access the essential membership for Modern Managers
- What business processes do you want to analyze?
- Are they operational, strategic, functional, etc.?
- What organization units are involved, and how much detail do you need to go into to spot inefficiencies?
2. Clarify the Processes You're Focusing On.
(In this context, a process is defined as a series of tasks that have a specific end result, such as hiring a staff member, producing a product, or acquiring a new customer.)
- For each process you're analyzing, what's the end result?
3. Identify All Participants in the Processes You're Analyzing.
These include all the organization units participating in the processes, and anyone who provides inputs or receives outputs from them. Depending on the level of detail you've chosen, these may be departments, teams, individuals, or even a computer system that performs certain parts of the process.
- Which organization units participate?
- Where do the inputs to the process come from?
- Who receives the output of the process?
Access the essential membership for Modern Managers
4. Start Creating the Diagram.
List the participants in the far-left column of the diagram.
Assign each of these participants to a horizontal band (swim lane). It's helpful to assign the swim lanes in sequence, with the first column assigned to the participant who provides the first input. (For customer-facing processes, this is often the customer.)
5. List the Step or Activities Required at Each Stage of the Process.
- Follow through the process sequentially.
- Remember that you're mapping how the process is currently being done – not how you think it should be done.
- The key to creating a useful diagram is to keep it as simple as possible. Try not to include too many loopbacks (unless you're focusing on exceptions) and keep the process mapping moving forward.
6. Analyze the Diagram for Potential Areas of Improvement.
- Are there any gaps or steps missing?
- Is there duplication?
- Are there overlaps, where several people or teams perform the same task or activity?
- Are there activities that add no value?
Access the essential membership for Modern Managers
Once you've identified potential areas for improvement, the next step is to decide how to address the issues and make changes. Rummler-Brache Diagrams can also be used at this stage to map out the proposed process changes.
As with any proposed changes in the organization, the pros and cons need to be analyzed, and any changes that follow must be carefully planned.
For example, if you're considering removing duplicate processes, you must first look at whether there's a legitimate need, and also what would be the impact of removing the duplication. A duplicate process may exist "legitimately" to provide, for example, proper financial or safety controls. (Techniques like Brainstorming and Impact Analysis can help you to think through the consequences of any change.)
Key Points
Swim Lane Diagrams/Rummler-Brache Diagrams are useful tools for identifying sources of inefficiency within, and between, processes and organization units.
By using structured pictures to show how processes achieve their aims, you can see at a glance who's responsible for what, and whether there are potential areas for improvement in the process.
Share this post
Discover more content

Improve on Ideas
Brainstorming is an excellent technique for generating improvement ideas. This team exercise encourages participants to collate a range of suggestions, then identify the best ones to progress further

Quality Circles
Many of the best improvement ideas come from groups known as quality circles. This article outlines the key points to consider when forming a quality circle.

An Introduction to Continuous Improvement
Continually improving performance needs to be at the forefront of an organization's mission and values. This article examines how such a focus creates and maintains an environment of excellence.